4SpecID User Interface. (A) Navigation Bar; (B) Statistical Results; (C) Action Buttons; (D) Graph Visualizer; (E) Record Editor; (F) Status Viewer.
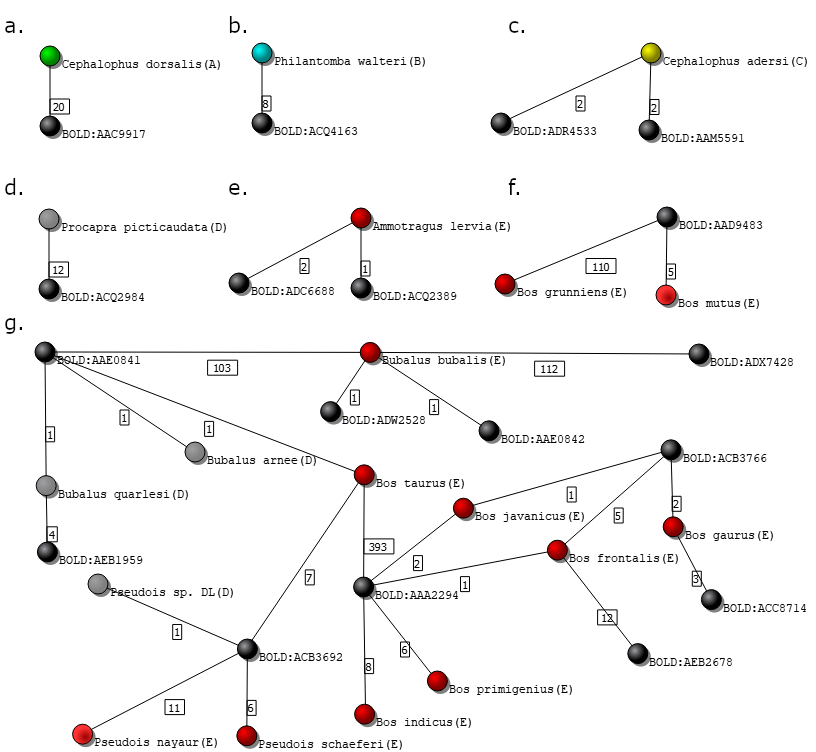
Example graphs. The entire dataset can be represented by a graph where species and clustering groups are represented by nodes and edges represent dataset records. (A) All specimens of Species 1 are grouped on Cluster 1 and vice-versa; (B) Species 1 contains specimens grouped on more than one cluster; (C) Cluster 1 contains specimens of more than one species. Dashed lines represent connections that may exist but are not mandatory to describe the example. The values inside each square represents edges weights.
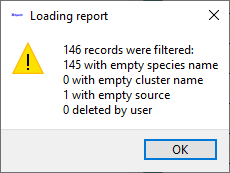
Loading Report Example
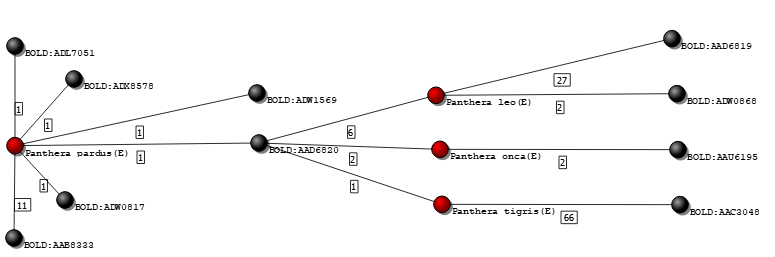
Isolated graph of species P. pardus, P. leo, P.onca and P. tigris